Basic HTML Version


3541
dx.doi.org/10.1021/es102790d |
Environ. Sci. Technol.
2011, 45,
3539–3546
Environmental Science & Technology
ARTICLE
exceed the standard. In statistical terms, this is referred to as
“
power
”
(Figure 1). To be environmentally protective, regulators
must determine the statistical power that is required to ade-
quately enforce BW discharge standards. Low power occurs
when the exceedance is small or when sampling is insu
ffi
cient to
yield adequate precision for detecting even a large exceedance.
18
From the vantage point of environmental protection, low power is
of great concern because sampling results can falsely suggest that no
signi
fi
cant threat is present.
19
Insu
ffi
cient sampling that yields low
power can result in a false sense of security, thereby undermining the
intended goals of a testing or monitoring program. To understand
which sampling designs maximize power (and optimize sampling
e
ff
ort), we calculated statistical power for a variety of sampling
e
ff
orts and zooplankton concentrations that exceed the compliance
concentration of <10 zooplankton
3
m
3
. A power value of 0.80 is
frequently considered su
ffi
cient to reliably detect statistical di
ff
ere-
nces.
18,20
Nevertheless, Di Stefano
21
argues that the selection of stati-
stical parameters should be based on the respective costs of false
positives (i.e., classifying BW as noncompliant when it actually meets
the standard) and false negatives (i.e., failing to identify BW that
exceeds the standard). We use power values of 0.8 as a reference for
comparison among sampling scenarios, but report results from a range
of values that correspond to power values ranging from <0.1 to 1.0.
Approach.
A two-stage sampling model was applied to a range
of hypothetical sample volumes, plankton concentrations, and
regulatory scenarios (i.e., levels of type I and type II errors).
Power to detect noncompliant discharge concentrations from the
proposed discharge standard was calculated for each combination.
Stage 1 assesses compliance based on a single sample and is expected
to be most useful when the degree of noncompliance is large. Stage 2
combines several independent samples to assess compliance and is
expected to improve discrimination when actual concentrations are
close to, but still exceed, the discharge standard.
Assumptions.
If zooplankton are randomly distributed through-
out BW discharge (i.e., the presence of one individual does not
influence the presence or absence of others), then the Poisson
distribution can be used to accurately predict sampling probabilities.
This is because integrating a nonhomogenous Poisson process
results in a Poisson distribution which has a mean equal to the mean
concentration in the discharge.
22
We employ the following postu-
lates when applying the Poisson distribution to BW discharge: (1)
the probability of having some number of organisms in one volume
is independent of the number in other discrete volumes; (2) the
probability of a single organism in a sample is proportional to
the volume of the sample; and (3) the probability of two or more
organisms in a very small volume is negligible.
The assumption that biota will be randomly distributed through-
out discharge is likely optimistic, since it presupposes that organisms
are independent of one another in a BW discharge. Planktonic
organisms in BW tanks are known to exhibit complex, yet un-
predictable spatial structure owing to diversity of ballast tank design,
operation, content, physical mixing that occurs in tanks, and
biological interactions and swimming behavior of plankton.
23
Furthermore, some biota are known to aggregate, such as colonial
or chain-forming phytoplankton (see Table S1, Supporting In-
formation). Appropriate sampling designs may help ameliorate the
e
ff
ects of aggregation though (see below). Nevertheless, assuming a
Poisson sampling distribution will provide the best case scenario
with respect to required sample volumes, thereby estimating a lower
volumetric limit for what is necessary and su
ffi
cient to characterize
BW discharge. When organisms are aggregated, estimates of con-
centrations will be more variable, and consequently larger sample
volumes must be taken to obtain reliable estimates of concentration.
The land-based testing centers that are currently evaluating
ballast treatment systems circumvent this problem by using in-
line sampling of the ballast discharge pipe to collect a represen-
tative sample of the entire discharge.
24
In this case, the Poisson
distribution can theoretically be used to accurately predict
sampling probabilities, but the sample must be well-mixed if an
additional subsampling step is performed. For ship-board testing,
time-integrated sampling of the entire discharge is probably not
possible; however, the problem of aggregation may still be
mitigated by sampling at several time points during discharge.
Alternatively, if only a single discrete sample is taken from the
discharge pipe, it may be indicative of the instantaneous concentra-
tion of discharge, but will not necessarily accurately estimate the
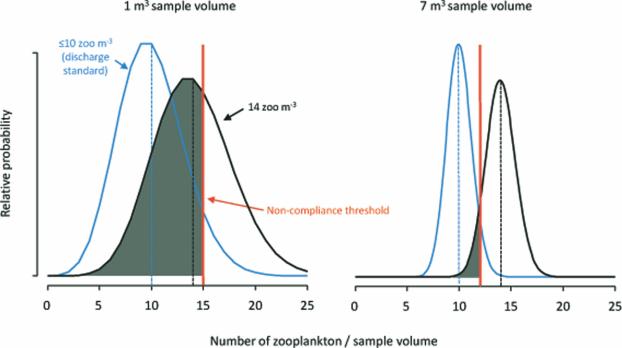
Figure 1.
Poisson sample distribution for a population with a concentration that meets the discharge standard of <10 zooplankton
3
m
3
(blue curves)
and a theoretical test population with a concentration of 14 zooplankton
3
m
3
(black curves) for sample volumes of 1 m
3
and 7 m
3
. Gray shading (
β
)
indicates regions where concentrations cannot be distinguished. Red vertical lines indicate the noncompliance threshold for
R
= 0.05 (Table 1); random
samples that are
e
noncompliance threshold are classi
fi
ed as compliant with discharge standards based on our de
fi
nition that ballast is
“
presumed
innocent
”
. When the concentration of ballast discharge is 14 zooplankton
3
m
3
, nearly 70% of 1 m
3
sample volumes will result in false negatives (power
≈
0.30 or 1
β
). About 8% of 7-m
3
sample volumes will result in false negatives (power
≈
0.92).