Basic HTML Version


3543
dx.doi.org/10.1021/es102790d |
Environ. Sci. Technol.
2011, 45,
3539–3546
Environmental Science & Technology
ARTICLE
of three BW treatment systems. The tests were conducted at the
Maritime Environmental Resource Center (a test facility at the
Port of Baltimore, Maryland, USA) to evaluate compliance with
the IMO discharge standard. For each treatment system, tests
occurred in 4 5 replicate trials, and all live zooplankton were
enumerated from 5-m
3
time-integrated samples for each trial.
Using the zooplankton counts, we analyzed per-trial results and
composite results using the summed Poisson method.
28 30
Importantly, while actual BW treatment system data are used
as examples to test our model, it was not our goal to draw
conclusions on the performance of any particular system or
approach.
’
RESULTS AND DISCUSSION
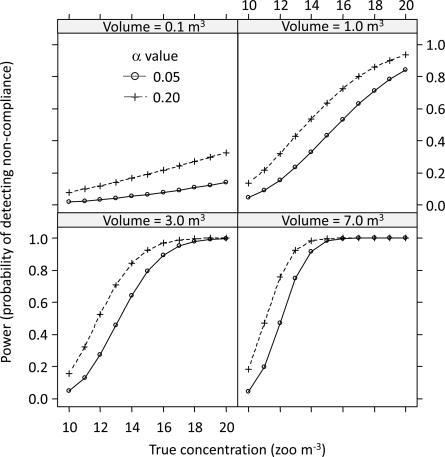
Single Trial Analyses.
For sample volumes of 1, 3, and 7 m
3
,
the noncompliance threshold concentrations are 15.0, 13.0, and
12.0 zooplankto
3
m
3
, respectively, if
R
= 0.05, and 13.0, 11.7,
and 11.0 if
R
= 0.20 (Table 1). When zooplankton concentra-
tions (10 20
3
m
3
) were modeled under the Poisson distribu-
tion (eqs 1a and 1b) at four sampling efforts (0.1, 1, 3, and 7 m
3
),
we observed substantial increases in power to discern statistical
differences between noncompliant and compliant (<10 zoo-
plankton
3
m
3
) concentrations (eq 1c) with larger sample
volumes (Figure 2). When
R
= 0.05, for a 1-m
3
sample volume,
zooplankton concentrations must be
g
20
3
m
3
before the
statistical power of the test to correctly identify a noncompliant
tank exceeds 0.8. Increasing
R
to 0.20 effectively reduces the
“
benefit of doubt
”
that ships are afforded; in this case, for a 1-m
3
sample volume, zooplankton concentrations must be
g
18
3
m
3
before statistical power exceeds 0.8. For
R
= 0.05, when sample
volume is increased to 3 m
3
, zooplankton concentrations of 15
and 18
3
m
3
can be differentiated from the discharge standard
with power = 0.8 and 0.98, respectively. Further power gains are
achieved when sample volume is increased to 7 m
3
: power = 0.92
for a concentration of 14
3
m
3
and near certain detection is
expected for concentrations above 15
3
m
3
(Figure 2). Not
surprisingly, further increasing sample volumes provides greater
precision and confidence; however, additional gains in precision
with incremental increases in volume diminish beyond 7 m
3
(Table 1) and the likelihood of nontreatment effects (i.e.,
increased mortality) with extended sampling and analysis is
expected to increase.
In a single trial, if zooplankton concentration exceeds the non-
compliance threshold, one can reliably infer (with high statistical
con
fi
dence) that the mean concentration of the discharge exceeds
the standard (see Table 1). As discharge concentrations approach
10 zooplankton
3
m
3
, it becomes progressively more di
ffi
cult to
di
ff
erentiate compliant from noncompliant samples. Since single
trial volumes cannot be increased inde
fi
nitely, it becomes necessary
to combine trials for further gains in statistical power.
Although we have chosen to concentrate exclusively on
sampling error in order to help de
fi
ne the lower limits of sample
volume, analytical recovery errors can introduce uncertainty that
will in
fl
uence enumeration and the required sample volume.
13,14
Recovery errors are expected to result in under-counting rather
than over-counting (i.e., sample bias, Table S1). Although
existing BW testing data are insu
ffi
cient to accurately parameter-
ize recovery errors, we investigated how hypothetical rates of
zooplankton recovery (100, 90, 75, and 50%) strongly a
ff
ect the
power to detect noncompliance. As expected, the putative e
ff
ect
of incomplete recovery is most pronounced for smaller sample
volumes and concentrations that are near the discharge standard
(Figure S1).
Multiple Trial Analyses.
Using repeated, independent trials of
a BW treatment system provides a more robust test of perfor-
mance than a single trial for multiple reasons. Repeated measures
are needed to test consistency in performance under a range of
conditions. Less appreciated is the potential use of a summed
Poisson analysis, whereby integrative sampling allows zooplank-
ton counts from multiple trials to be added together, providing a
cumulative probability based on total volume sampled (Table 1).
This approach can overcome many critical limitations of volume
and handling time for single trials. Using this summed Poisson
technique, statistical power exceeded 0.8 when comparing con-
centrations of 14, 13, and 12 zooplankton
3
m
3
(with 1, 2, and 3
trials respectively; 7 m
3
per trial;
R
= 0.05) to the discharge
standard (Figure 3). Nearly 100% power was achieved for all
three test concentrations with 7 trials (total volume = 49 m
3
). As
concentrations approach the discharge standard, more trials are
required before power exceeds 0.8. When the 11 zooplankton
3
m
3
concentration was examined, 10 trials (70 m
3
) were
required to attain a power of 0.8 when
R
= 0.05 (Figure 3).
When small sample volumes are used, there is a high probability
of mistakenly attributing observed counts to a compliant con-
centration due to extensive overlap of concentration distribu-
tions, with either a single trial or the summed Poisson approach.
For example, with a sample volume of 0.1 m
3
the power to detect
a moderate exceedance (14
3
m
3
or 40% above the IMO
standard) is very low (
∼
0.05). Even when ten trials are com-
pleted, power to detect exceedance is still low (
∼
0.35)
(Figure 2). However, increasing sample volume from 0.1 or 1.0
to 7 m
3
enables robust differentiation (power > 0.9) of non-
compliant zooplankton concentrations of 14
3
m
3
and greater
from the IMO standard.
The application of the summed Poisson approach is simple
and can be applied iteratively as test results become available. If
Figure 2.
Power of the Poisson one-sample test to detect noncompli-
ance with a discharge standard of <10 zooplankton
3
m
3
as a function of
sample volume (0.1, 1, 3, or 7 m
3
), discharge concentration (10 20
zooplankton
3
m
3
), and
R
= 0.05 and 0.20.